01
Green dashboards can hide broken products
A health check pinging '/' can return 200 OK while the checkout flow or payment gateway integration is completely broken for real users.
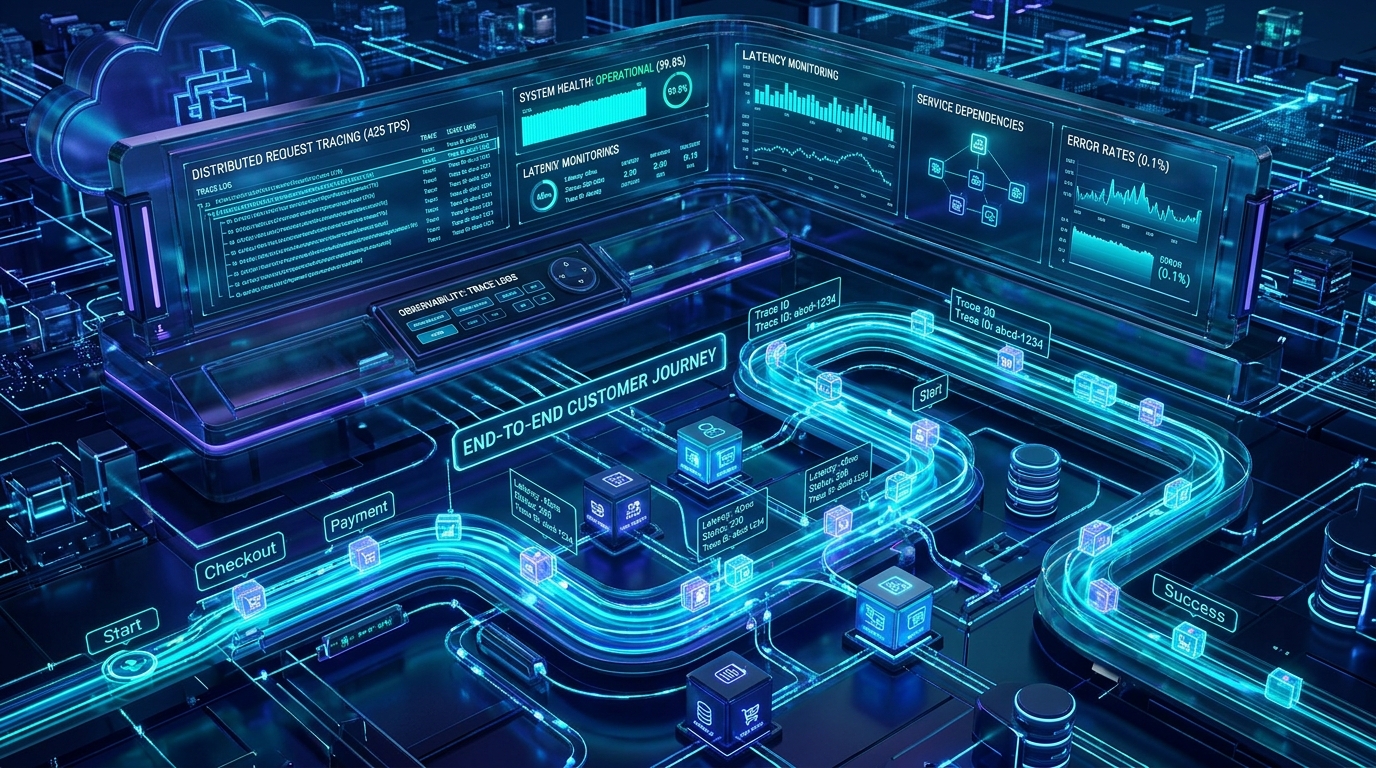
Modern observability focuses on business-critical journeys: signup completions, checkout success rates, and webhook processing latencies.
02
Structured logs and distributed traces
Pass a unified request ID from the user click in the browser through API gateways down to database queries. When an error occurs, engineers can inspect the exact timeline in seconds.
- →Emit JSON logs with standardized tenant, user, and journey tags.
- →Track 95th and 99th percentile latencies to catch degraded performance.
- →Set up synthetic probes that execute end-to-end user transactions every 5 minutes.
If your team learns about production outages from angry customers, your monitoring is already obsolete.
03
Alert on trends, not noise
Transient spikes happen. Alert on sustained degradation over a multi-minute window to prevent alert fatigue while catching real incidents immediately.
Written bySimpluxe Architecture
Back to insights